
Morihisa Fujita
Professor at the Institute for Glyco-core Research (iGCORE), Gifu University
He received his PhD in 2006 at The University of Tsukuba, and then joined the National Institute of Advanced Industrial Science and Technology (AIST) as a postdoctoral fellow. He worked as a postdoctoral fellow at the University of Geneva in 2006. He joined Osaka University as a postdoctoral fellow in 2007. He became a Specially Appointed Assistant Professor at Osaka University in 2008 and an Assistant Professor in 2012. He moved to Jiangnan University as a Professor at Key Laboratory of Carbohydrate Chemistry and Biotechnology in 2014. In 2022, he was given his current position. His research interests focus on the biosynthesis and engineering of glycans.
Glycans are essential biomolecules that participate in a broad spectrum of biological processes, including protein stabilization, intracellular trafficking and localization, cell adhesion, intercellular communication, and signal transduction. In contrast to nucleic acids and proteins, glycans are synthesized and degraded in a stepwise, non-template-driven manner through the coordinated actions of multiple glycosyltransferases and glycosidases. Their structural diversity—encompassing various isomers and charged residues—renders glycan analysis technically challenging, requiring sophisticated analytical techniques and specialized expertise. Consequently, it remains difficult to determine which glycan structures are synthesized in specific cells or tissues. To address these challenges, we developed GlycoMaple, a user-friendly platform for visualizing glycan metabolic pathways. Leveraging transcriptomic data derived from RNA sequencing analysis of cells or tissues, GlycoMaple enables users to predict the repertoire of glycans likely to be synthesized. Moreover, by comparing datasets across multiple samples, the tool facilitates the identification of differences in glycan metabolic profiles. GlycoMaple serves not only as a valuable complement to experimental glycomics but also as a versatile resource for applications such as glycoengineering and the discovery of disease-associated glycan markers. In this review, we describe the development of GlycoMaple, highlight its features and functionalities, showcase representative applications, and discuss future directions.
Glycans are complex molecules composed of monosaccharides such as glucose, galactose, mannose, fucose, and sialic acid. They are widely distributed on the cell surface and in extracellular secretions, existing either as free glycans or as components of glycoconjugates covalently attached to proteins or lipids. In mammals, including humans, a variety of glycan classes are found: free glycans such as hyaluronan; glycolipids such as gangliosides; and multiple types of protein-linked glycans, including N-glycans, O-glycans, glycosylphosphatidylinositol anchors, and C-mannosylated structures1. These glycans play crucial roles in diverse biological processes, including protein folding and stability, intracellular trafficking, cell adhesion, intercellular communication, and signal transduction. Moreover, glycan structures are intimately associated with disease processes. They often serve as cellular entry points for viruses, bacteria, and toxins, and their expression patterns are frequently altered under pathological conditions2,3. As such, glycans are functionally important in both physiological and pathological contexts, and the ability to define glycan structures is critical not only for basic biological research but also for the development of therapeutics and clinical diagnostics.
Unlike nucleic acids and proteins, glycans are not synthesized based on a template.
Instead, their biosynthesis and degradation are regulated in a stepwise and competitive manner by the products of approximately 950 glycan-related genes, including more than 200 glycosyltransferases localized in the endoplasmic reticulum and Golgi apparatus, as well as glycosidases, transporters, substrate-synthesizing enzymes, and glycan-binding proteins (lectins)4. The resulting glycan structures are influenced by multiple factors, such as enzyme substrate specificities, gene expression levels, subcellular localization, nucleotide-sugar availability, and the differentiation or disease status of the cell. Consequently, predicting the exact repertoire of glycans present in a cell type remains a significant challenge.
Comprehensive glycomic analyses are typically conducted using techniques such as mass spectrometry (MS), high-performance liquid chromatography (HPLC), and lectin arrays. While powerful, these methods are often labor-intensive and technically demanding, particularly for large, isomeric, or highly charged glycans. Lectin arrays, while more accessible, provide only partial information and cannot fully resolve complete glycan structures. In contrast, transcriptomic data derived from RNA sequencing (RNA-seq) offer a comprehensive snapshot of gene expression, including that of glycan-related enzymes. However, a straightforward approach to link transcriptomic data to the prediction of glycan structures has been lacking.
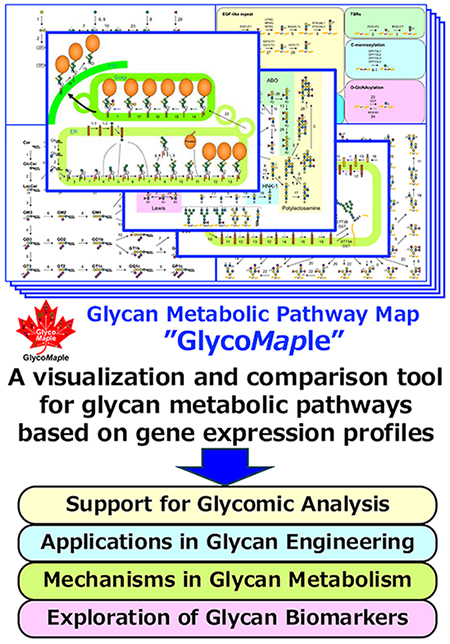
To overcome this limitation, we developed GlycoMaple, a visualization tool that estimates glycan structures based on gene expression profiles5,6. GlycoMaple overlays the expression levels of genes involved in glycan biosynthesis and degradation onto curated glycan pathway maps, allowing users to infer the glycan structures potentially synthesized in specific cells or tissues (Figure 1). This tool enables the identification of rate-limiting steps in glycan metabolic pathways and facilitates comparative analyses across different biological conditions or sample types.
Understanding which glycans are synthesized in specific cells or tissues provides critical insight into cellular states and functions. However, conventional structural analyses of glycans using MS or HPLC are technically demanding and often limited in their ability to comprehensively and simultaneously characterize the full spectrum of glycan structures. In contrast, advances in next-generation sequencing technologies have enabled the widespread use of RNA-seq for transcriptomic profiling7, providing accurate quantification of gene expression, including that of glycosyltransferases, glycosidases, and nucleotide sugar transporters. Building on this capability, we hypothesized that the glycan structures potentially synthesized in a cell or tissue could be inferred by visualizing glycan metabolic pathways and mapping gene expression levels to the corresponding enzymatic reactions.
To develop GlycoMaple, we first curated a comprehensive list of approximately 950 human genes involved in glycan metabolism. This gene set included those encoding glycosyltransferases, glycosidases, nucleotide sugar synthesis enzymes, sugar transporters, regulators, and glycan-binding proteins (lectins). We then constructed custom pathway maps encompassing 21 major human glycan metabolic pathways. These maps were illustrated using the Symbol Nomenclature for Glycans (SNFG) and organized to explicitly link each enzymatic reaction to its corresponding gene(s) (Figure 1). To facilitate intuitive interpretation, the expression level of each gene—measured in transcripts per million (TPM)—is visualized through the color intensity and thickness of arrows representing the enzymatic reactions. By default, for reactions catalyzed by multiple enzymes, the gene with the highest TPM value is used for visualization. In contrast, for reactions requiring multi-subunit enzyme complexes, the TPM value of the least-expressed subunit is used, representing the rate-limiting step.
To validate GlycoMaple, we applied the tool to RNA-seq data from human embryonic kidney 293 (HEK293) cells and compared the predicted mucin-type O-glycan structures with those experimentally determined by glycomic analysis5. When applying a TPM threshold of 1, the predicted glycan structures showed strong concordance with the experimentally observed ones. These results demonstrate that GlycoMaple enables intuitive visualization of glycan biosynthetic pathways and provides a practical framework for inferring glycan structures that are theoretically synthesizable based on gene expression profiles.
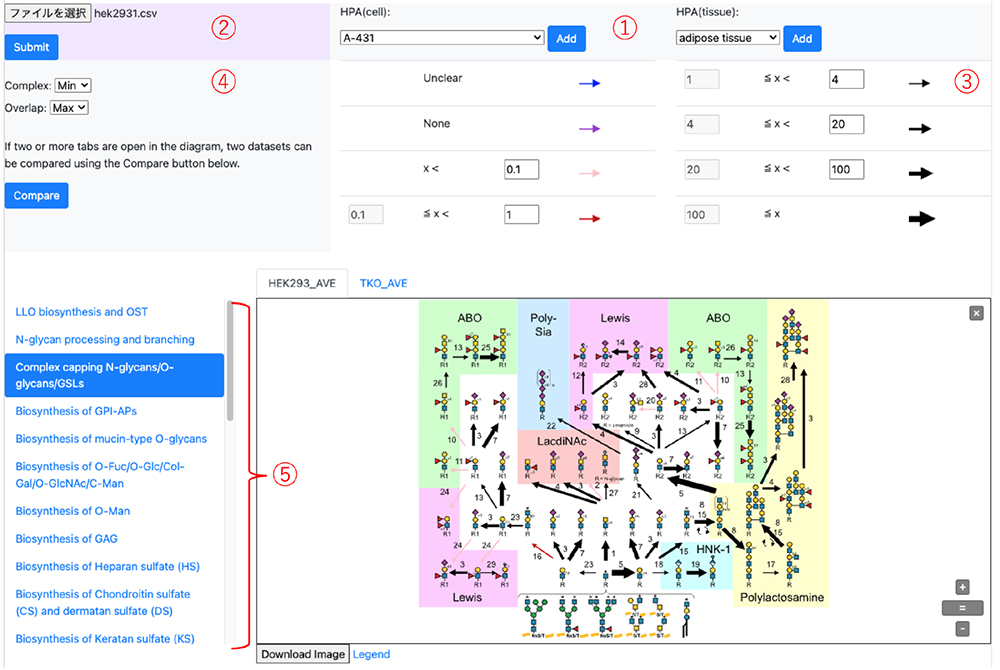
GlycoMaple is available via the GlyCosmos Portal (https://glycosmos.org/glycomaple) and can be accessed through any modern web browser8. The human version of GlycoMaple is preloaded with gene expression data from cultured human cells and tissues, curated from The Human Protein Atlas (HPA) (Figure 2-①). Users can select specific cell types or tissues to visualize and explore glycan metabolic pathways. Alternatively, custom RNA-seq datasets in comma-separated value (csv) format can be uploaded for user-defined analyses (Figure 2-②). Detailed usage instructions are described elsewhere9,10.
Within the visualization interface, each glycosylation reaction is represented by an arrow, the color and thickness of which are determined by the expression level of the corresponding enzyme gene(s) (Figure 2-③), measured in TPM. By default, a TPM threshold of 1 is applied: reactions with gene expression exceeding this value are displayed as black arrows, with thickness proportional to TPM. Reactions with low expression are considered inactive and shown in red (TPM < 1) or pink (TPM < 0.1). These thresholds are user-configurable to accommodate diverse analytical needs. As noted previously, when multiple enzymes can catalyze a given reaction, the gene with the highest TPM is used by default. For enzyme complexes, the lowest TPM among the subunits is applied to reflect the limiting factor for complex formation (Figure 2-④). Users may override these defaults by selecting alternative aggregation rules (minimum, maximum, average, or sum of TPM values).
GlycoMaple currently offers 21 glycan metabolic pathway maps (Figure 2-⑤). Upon input of gene expression data, the pathways are dynamically rendered, with arrow colors and thicknesses updated accordingly. Clicking on an arrow provides a direct link to the corresponding gene entry in the HUGO Gene Nomenclature Committee database for further reference. Bar plots showing the expression levels of all pathway-associated genes are also displayed below each map5. When multiple samples are loaded, the “Compare” function becomes available, allowing for side-by-side visualization of glycan metabolic pathways. Differences in gene expression between samples are reflected in the pathway maps by changes in arrow color—green indicating decreased expression and pink indicating increased expression—thus enabling intuitive comparative analysis.
GlycoMaple enables intuitive and comprehensive visualization of glycan biosynthetic and degradative pathways based on gene expression data, making it a versatile tool for diverse applications in glycoscience (Figure 1). Representative use cases are described below.
MS is widely used for glycan structural analysis and is effective in determining glycan composition. However, it often falls short in resolving structural details such as linkage types. For example, in glycans containing terminal sialic acids, it is difficult to distinguish between α2,3- and α2,6-linkages solely based on MS data. GlycoMaple provides a complementary approach by visualizing the expression profiles of glycan-related enzymes in specific cells or tissues. In the case of sialylation, inspection of sialyltransferase gene expression enables users to estimate the likely linkage type, thereby narrowing down candidate structures. This function serves as a theoretical support to experimental glycomics and facilitates more informed structural interpretation.
GlycoMaple offers a rational framework for glycoengineering by allowing users to predict glycan metabolic pathways and identify rate-limiting steps. When targeting specific glycan structures for enhancement or suppression, the impact of gene manipulations—such as overexpression or knockout of glycosyltransferases—can be assessed. GlycoMaple dynamically visualizes how such modifications influence the overall pathway, enabling the design of effective glycoengineering strategies. A Clustered Regularly Interspaced Short Palindromic Repeats (CRISPR)-based knockout cell library targeting glycan-related genes in HEK293 cells is currently under development5,11,12. Integration of these perturbation datasets with GlycoMaple will allow systematic evaluation of how individual gene disruptions affect glycan biosynthesis.
GlycoMaple also facilitates investigation of regulatory mechanisms governing glycan biosynthesis. By comparing gene expression profiles across time points or experimental conditions, users can identify key regulatory nodes and metabolic bottlenecks5,13. For instance, in cells with knockout of MAN1A1, MAN1A2, and MAN1B1—genes encoding N-glycan trimming enzymes—a marked upregulation of hyaluronan synthase 2 (HAS2) was observed, resulting in increased hyaluronan production5. Additionally, elevated levels of glycolipids containing N-acetyllactosamine units were detected, suggesting compensatory mechanisms across glycan classes.
In another study, transcriptomic analysis under oxidative stress followed by GlycoMaple visualization revealed upregulation of FUT8, an α1,6-fucosyltransferase14. Subsequent lectin staining confirmed corresponding increases in core-fucosylated glycans, highlighting the tool’s utility in capturing dynamic glycosylation responses to environmental stimuli. These examples demonstrate GlycoMaple’s capacity to generate hypotheses and guide experimental validation in studies of glycan regulation.
GlycoMaple can be used to identify glycan biomarkers and potential therapeutic targets by comparing glycan-related gene expression between healthy and diseased tissues. Differential visualization of glycan metabolic pathways enables detection of disease-specific glycan structures and aberrant expression of associated enzymes13,15. For example, in a comparative analysis of colorectal cancer and adjacent normal tissue, significant alterations were observed in the expression of MGAT5, B3GNT2, FUT3, and ST6GAL1, implicating these glycosyltransferases in the biosynthesis of tumor-associated glycans5. When integrated with glycoproteomic data, GlycoMaple supports a powerful multi-omics approach for uncovering functional roles of glycans in disease pathogenesis and for discovering novel biomarkers or therapeutic targets.
GlycoMaple is a computational tool designed to infer glycan metabolic pathways based on gene expression data; however, it does not directly confirm the actual presence of specific glycan structures. Notably, mRNA expression levels do not always correlate with enzymatic activity. Multiple factors—such as the subcellular localization of enzymes, availability of nucleotide sugar donors, abundance of acceptor substrates, and intracellular transport dynamics—can significantly influence glycan biosynthesis. Consequently, pathway predictions generated by GlycoMaple may include false positives or false negatives. Therefore, the visualized pathways should be interpreted as hypotheses that provide guidance for further investigation, rather than definitive representations of glycan structures5. Experimental validation, particularly through techniques such as MS, remains essential for confirming glycan presence and structural details.
Currently, GlycoMaple enables gene expression-based prediction of glycan structures that are theoretically synthesizable in specific cells or tissues. However, it remains challenging to quantitatively estimate the actual abundance of each glycan species. Furthermore, GlycoMaple does not yet incorporate dynamic regulatory features such as feedback mechanisms within glycan metabolic pathways. To address these limitations, recent efforts have been directed toward the development of dynamic models of glycan biosynthesis that integrate enzymatic kinetics and machine learning techniques16-18. In particular, predictive frameworks that take into account enzyme activity and subcellular localization of glycosyltransferases are being explored to more accurately simulate glycan production. Our research group is working to construct such dynamic models, beginning with key enzymes responsible for N-glycan branching6,19. By integrating enzyme activity measurements, glycan structural data obtained from gene knockout cell lines, and transcriptomic profiles, we aim to establish models that better represent the dynamic behavior of glycan biosynthesis. There is also growing interest in expanding GlycoMaple’s functionality to accommodate additional data types and biological contexts. For example, a mouse version of GlycoMaple is currently available in limited release (manuscript in preparation), and support for single-cell RNA-seq data is under development. Future updates will focus on enhancing usability and extending the platform's applicability across different species and levels of resolution.
GlycoMaple is a novel visualization tool that facilitates intuitive and comprehensive analysis of glycan biosynthesis and degradation pathways based on gene expression data—a task that has traditionally posed significant technical challenges. The platform is designed to make the complex and highly specialized field of glycan metabolism more accessible to a broad range of researchers. By simply uploading transcriptomic data, users can visualize the entire landscape of glycan metabolic pathways in a user-friendly interface. Given its ease of use and analytical power, GlycoMaple provides an accessible entry point for researchers who are new to glycobiology. Since glycans are involved in numerous physiological processes and pathological conditions, we anticipate that GlycoMaple will be increasingly adopted across various research areas, including cancer, immunology, infectious diseases, stem cell biology, and drug discovery.