


Single-cell glycan/RNA sequencing method | ||||||||||||||
 |
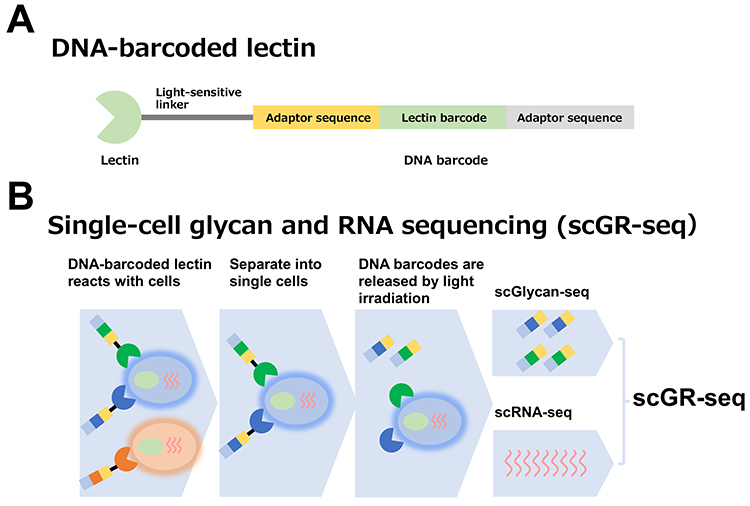
The scRNA-seq method for analyzing the transcriptome of a single cell is used worldwide as an essential technology for life science research. Glycans (glycome) are essential biological information located at the outer-most layer of cells and are involved in diverse biological phenomena by regulating multicellular interactions. Conventional methods to analyze glycome include mass spectrometry, liquid chromatography, capillary electrophoresis, and lectin microarrays. However, all of these techniques can only analyze cell populations (bulk) and cannot analyze the expression of glycans per cell. Why is it difficult to analyze glycome in single cells? This is because glycan information cannot be easily amplified by polymerase chain reaction (PCR) like genetic information. Therefore, we thought that by using multiple DNA barcode-labeled lectins, it would be possible to convert glycan information into genetic information, amplify it by PCR, and simultaneously analyze glycan expression and gene expression in individual cells by next-generation sequencing (NGS) (1).
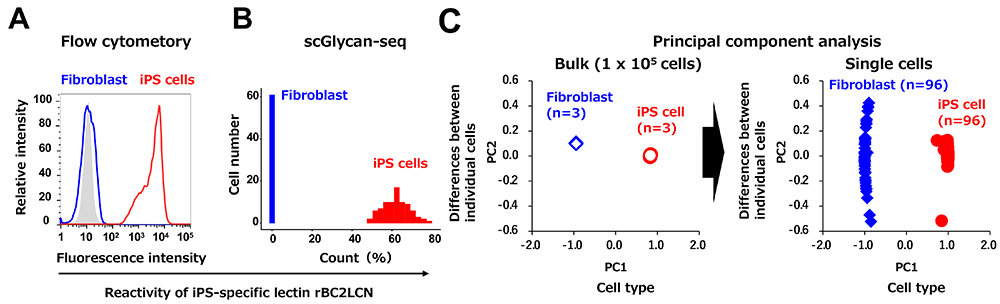
First, we validated the scGlycan-seq method using iPS cells and fibroblasts. The previously identified iPS cell-specific lectin (rBC2LCN) bound to iPS cells showed high fluorescence intensity in flow cytometric analysis. On the other hand, the lectin did not react with fibroblasts, and no fluorescence was detected (Fig. 2A). Similar to the flow cytometry results, in the scGlycan-seq method, the iPS cell-specific lectin showed high reactivity to iPS cells, but not to fibroblasts (Fig. 2B). Therefore, the scGlycan-seq method gave the same results as the standard method. Furthermore, using a statistical analysis technique called principal component analysis, cells were classified based on the reaction patterns of about 40 different lectins (Fig. 2C). In the bulk data, individual cells were clearly distinguished by cell type (iPS cells and fibroblasts), indicating that differences in glycan expression could be detected by cell type. However, the three replicate samples (n=3) are plotted in the same place, and no differences between individual cells can be detected (Figure 2C). On the other hand, when cells were classified in the single-cell data, they were not only identified by cell type, but also differences between individual cells were detected (Figure 2C). In other words, the single-cell Glycan-seq method can detect differences in glycan expression from one cell to another. Furthermore, analysis of the differentiation process from human iPS cells to neural progenitor cells revealed a gradual transition in glycan profiles. The reactivity of human iPS cell-specific lectin rBC2LCN gradually decreased during differentiation. In other words, the scGlycan-seq method can be used to quantitatively analyze the changes in glycan expression from one cell to another.
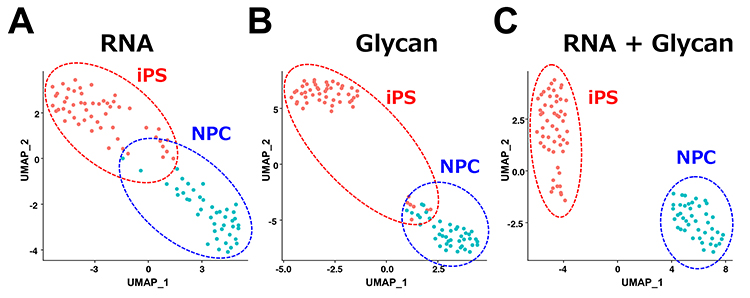
Next, human iPS cells and neural progenitor cells were analyzed using the scGR-seq method, and the obtained data were analyzed using a statistical analysis method called UMAP (Uniform Manifold Approximation and Projection for Dimension Reduction). The two cell types (human iPS cells and neural progenitor cells) could not be completely distinguished using only one of the cellular information (RNA or glycans) (Fig. 3A, B). On the other hand, the use of both cellular information (glycans and RNA expression) accurately discriminated the two cell types (Fig. 3C). Furthermore, pseudo-time analysis and partial least squares regression (PLS) confirmed that the human iPS cell-specific lectin rBC2LCN showed the highest correlation with the pluripotency gene marker (POU5F1). Furthermore, we were able to identify a new glycan marker and lectin probe for neural progenitor cells.
Conventional glycome analysis techniques require the isolation of individual cells in a cell population and the use of at least 10,000 cells for analysis. In addition, expression of glycogenes is generally low, and it was difficult to analyze glycan expression in each cell by scRNA-seq. scGR-seq enables the simultaneous analysis of glycans for each cell in a cell population. Therefore, it is possible to obtain glycan expression information on subpopulations of cells and rare cells, which has been difficult with conventional glycome analysis technology. In addition, since the relationship between the glycome and transcriptome can be elucidated, new functional elucidation of glycans can be expected (3). scGR-seq is expected to be applied to the design of standardized tests and manufacturing process items for cell products, optimization of culture methods, and the search for new glycan-targeted drugs. It is the birth of a new tool for single-cell analysis in glycobiology, and the dawn of the era of single-cell glycomics (4). Hiroaki Tateno
| |||||||||||||
| References | |
|---|---|
| (1) | Minoshima F, Ozaki H, Odaka H, Tateno H: Integrated analysis of glycan and RNA in single cells. iScience 24, 102882, 2021 |
| (2) | Odaka H, Ozaki H, Tateno H: scGR-seq: Integrated analysis of glycan and RNA in single cells. STAR Protoc. 3, 101179, 2022 |
| (3) | Oinam L, Minoshima F, Tateno H: Glycan profiling of the gut microbiota by Glycan-seq. ISME Commun. 2, 1, 2022 |
| (4) | Oinam L, Tateno H: Glycan Profiling by Sequencing to Uncover Multicellular Communication: Launching Glycobiology in Single Cells and Microbiomes. Front. Cell Dev. Biol. 10, 919168, 2022 |
Jun. 15, 2023